
It has come to an end at last. Juventus’ nine-year reign in Italian football was ended by Inter, who won their first Serie A title since 2010. The Nerazzurri clinched their 19thScudetto in the club’s history – surpassing city rivals Milan, who have 18 titles to their name – following Atalanta’s one-all draw with Sassuolo on May 2, 2021.
Antonio Conte – who began Juventus’ record title-winning streak in 2012 – has won it for the fourth time in his coaching career in Italy, making him the fifth most successful manager in Serie A’s history.
The former Juventus and Chelsea coach is arguably the most important piece in this sublime Inter puzzle, leading the Nerazzurri to the title in just two seasons.
In this analysis, we looked at what made Inter the best team in Italy this season by analyzing some of the key offensive and defensive performance metrics.
Inter Formations and Most Common Starting Line-Up
Conte has been known throughout his managerial career for using a three-man defensive formation, which is either a 3-5-2, or a 3-4-1-2. Inter were one of the teams that quickly felt the effects of Conte’s playing philosophy. The Nerazzurri switched from a four-man defensive formation – 4-2-3-1 or 4-3-3 – when Luciano Spalletti was in charge from 2017 to 2019, to a 3-5-2 after the former Chelsea boss took over Inter in the summer of 2019.
This season, the newly-crowned Serie A champions have been playing with a three-man defensive formation since match-day one, with the go-to set-up being a 3-5-2. It has been used in a total of 28 games. This consistency in terms of sticking to the same tactical formation for most of the season is one of the main reasons for Inter’s title success.
In addition, another decision that proved instrumental in Inter winning their 19thScudetto was the fact that Conte was also very consistent with his starting eleven, which underwent very few changes throughout the season. Overall, it seems that the Italian head coach executed a master plan in not experimenting too much. A good adage of “don’t fix what’s not broken” can be applied in this case.
The consistency in Inter’s starting line-up deployed week after week becomes clear when we analyze the playing time of each player in numbers. Remarkably, the same nine Inter players have been selected to play from the first minute on at least 27 occasions, accounting for 77% of the total playing time across the squad. In simple terms, this means that the same nine players were in Inter’s starting line-up in 77% of Serie A games, meaning that the rest of the squad made the starting XI only 23% of the time.
Specifically, the nine players who made up 77% of the total playing time in the starting line-up are as follows: Samir Handanovic (35 appearances); Alessandro Bastoni (31 appearances); Romelu Lukaku (30 appearances); Nicolò Barella (30 appearances); Milan Skriniar (29 appearances); Stefan de Vrij (29 appearances); Lautaro Martinez (28 appearances); Achraf Hakimi (27 appearances); Marcelo Brozovic (27 appearances).
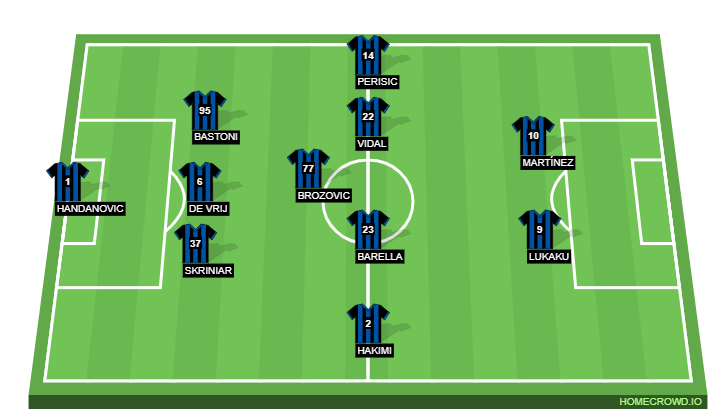
This statistical point is perfectly illustrated in the graph below, which shows Inter’s most used line-up in the 2020-21 Serie A season. The left-sided central midfield and left wing-back are the only two positions that saw a bigger competition between the players. Arturo Vidal (14 appearances) and Christian Eriksen (16 appearances) were the two players who mostly fought for a place in left central midfield role, whereas Ivan Perisic (19 appearances), Ashley Young (15 appearances) and Matteo Darmian (12 appearances) were often rotated at left wing-back depending on the opposition.
Key Performance Metrics
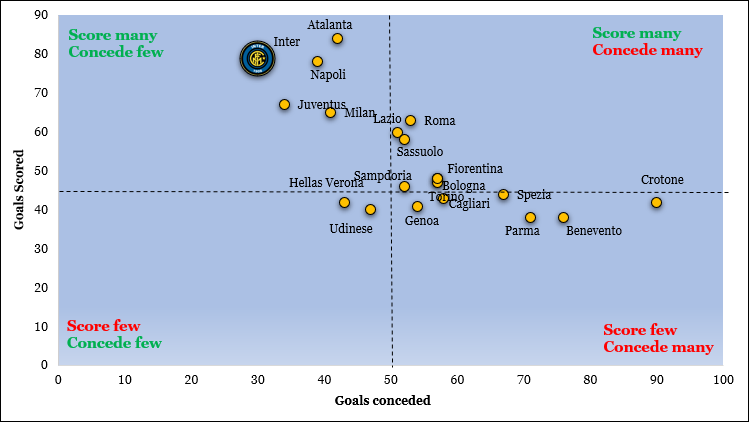
We begin the main part of the analysis by looking at the most basic statistical metrics in football: goals scored and goals conceded. Unsurprisingly, teams that score more goals and conceded fewer usually emerge victorious. As one would expect, Inter have one of the best records in both of the aforementioned metrics, scoring 79 goals and conceding just 30 in 35 matches. The Nerazzurri rank second in the goals scored metric – behind only Atalanta with 84 goals – and are the best defensive side in the league this season.
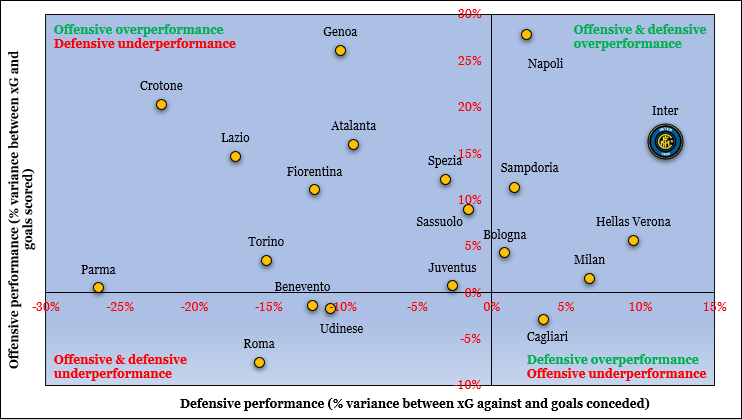
In the next chart, we examine Inter’s defensive and offensive performance in terms of their actual goals scored and conceded compared to expected goals. We can see that the Nerazzurri are one of the six teams that have a better performance rating in the percentile rage in both the defensive and offensive metrics. In detail, Conte’s side are 16% better in terms of their offensive output than predicted by the expect goals for (xGF) indicator, while it is also 12% better defensively when analyzing the percentage variance between goals conceded and expected goals against (xGA).
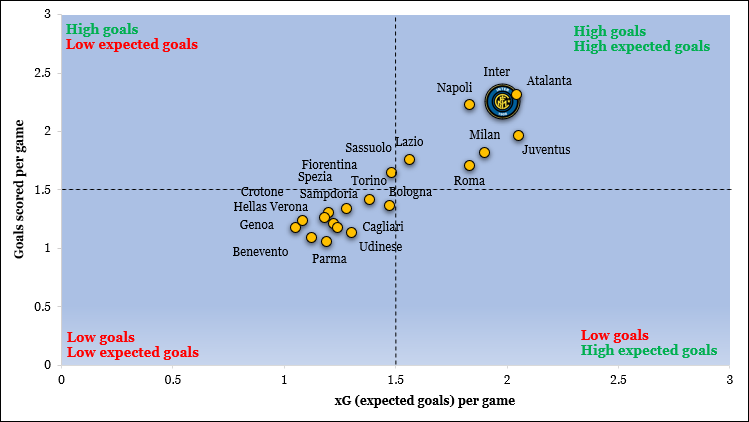
Moving on, we analyze the relationship between the performance metrics of goals scored and expected goals (xG) in its pure form. We can see that Inter are one of the seven teams that are the top performers in both metrics. The Nerazzurri are averaging 1.98 expected goals (xG) this season – behind Juventus (2.05 xG) and Atalanta (2.04 xG) – but climb to second place when we look at actual goals scored per game with 2.26, indicating a slight overperformance. Nonetheless, most teams that win the league outperform the metric of expected goals, which suggests two things: 1) A team is lucky 2) A team is good at converting chances, even when less likely to score. In this case, Inter fall more into the second category of teams after watching Conte’s men play all season.
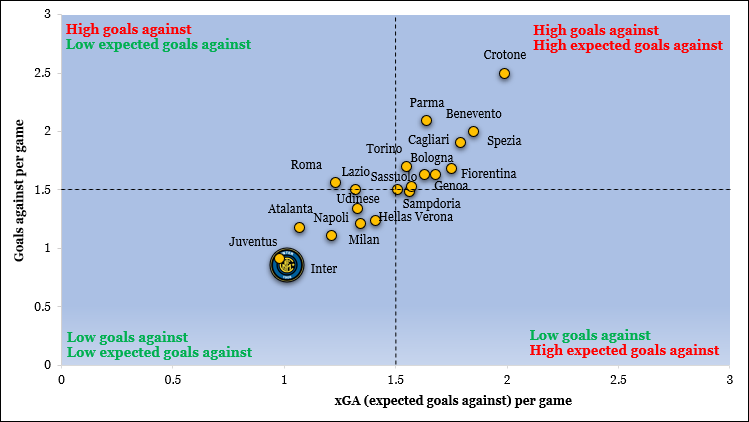
The same analysis was done for the contrasting metrics of goals conceded and expected goals against (xGA). Unsurprisingly, Inter once again join the list of the top three teams, with the Nerazzurri showing the best defensive record in Serie A, conceding just 0.86 goals per game. However, the expected goals against metric indicates that Inter’s defensive line has slightly overperformed this season, with an average of 1.01 xGA per game – second best in the league behind Juventus with 0.98.
Inter in Possession
There has been a visible trend over the last couple of seasons that shows domestic championships are won by teams that are most dominant in possession of the ball. The logic behind this is quite simple – teams that have more possession can create more scoring chances, while preventing the opposition from attacking their own goal. However, if we look at Inter’s performances this season, it is clear that Conte’s propagated style of play was much more direct, with vertical ball progression at speed and playing to the strengths of each individual player. Therefore, the following analysis will look at Inter’s key performance indicators in terms of ball possession.
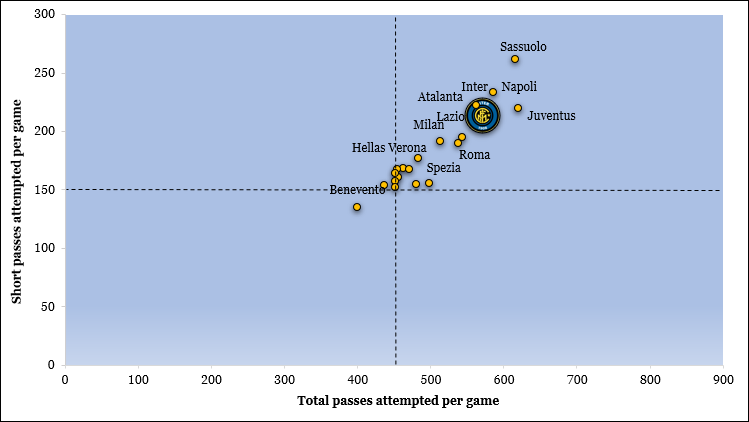
The Nerazzurri are averaging 52.4% possession this season, which only puts the newly crowned Scudetto winners 8th in the league standings. However, if we take a closer look at the passing statistics, there are clear indications showing that Inter play a more direct style of football under Conte. Despite only having the 8th highest possession in Serie A, the Nerazzurri attempt the 4th highest number of passes per game (avg. 571.0). This suggests that Inter tend to distribute the ball with more purpose and intention to drive forward without retaining it for too long, which allows them to attempt more passes.
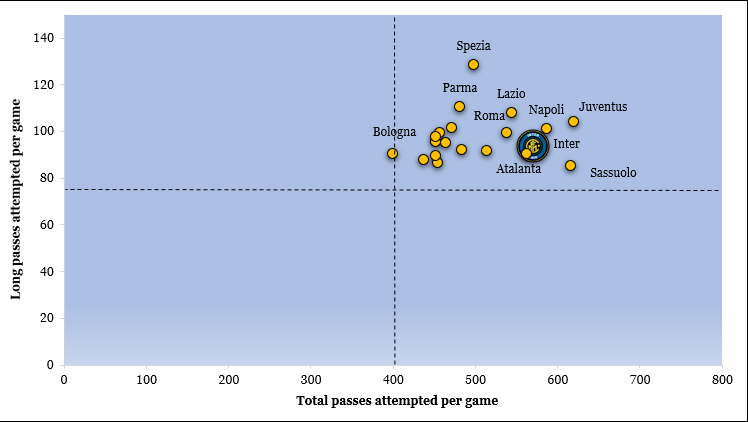
In the following part of our analysis, we examine the relationship between total and long passes attempted. Looking specifically at long passes, Inter rank 4thout of the top six teams in Serie A, averaging 93.8 long passes per game. Overall, the Nerazzurri rank 12thout of all 20 teams in this performance metric. However, it should be noted that although Conte’s side play a more direct and vertical football, they still rely more on short to medium passes in order to move the ball at speed.
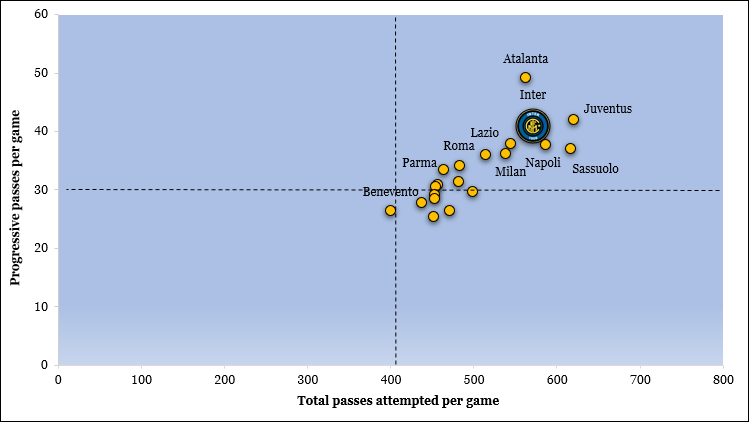
The performance indicator of progressive passes is one of the better ways to assess the verticality of a team’s positional play. Inter rank 3rd in Serie A with an average of 41.1 progressive passes per game, with only Atalanta recording a significantly greater number at 49.3 considering that Gian Piero Gasperini’s men averages 8 fewer passes per game than the Nerazzurri. In comparison, Sassuolo attempt an average of 45 more passes more than Inter, but at the same time the Neroverdi only play 37 progressive passes per game, indicating slower possession football.
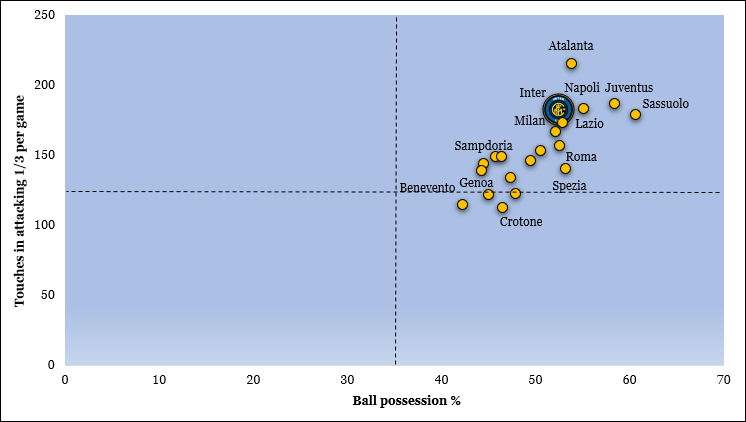
Adding to the above, Inter’s effective use of possession is best explained by the following part of the analysis. As mentioned earlier, Conte’s side only record the 8th highest possession in Serie A this season (avg. 52.4); however, the way the Nerazzurri use their time on the ball enables them to spend more time in the attacking third of the pitch despite having less possession overall. Inter have the 3rd highest number of touches in the final third area at 182.9 – behind Juventus and Atalanta – which shows that a more progressive and vertical build-up approach works in their favor.
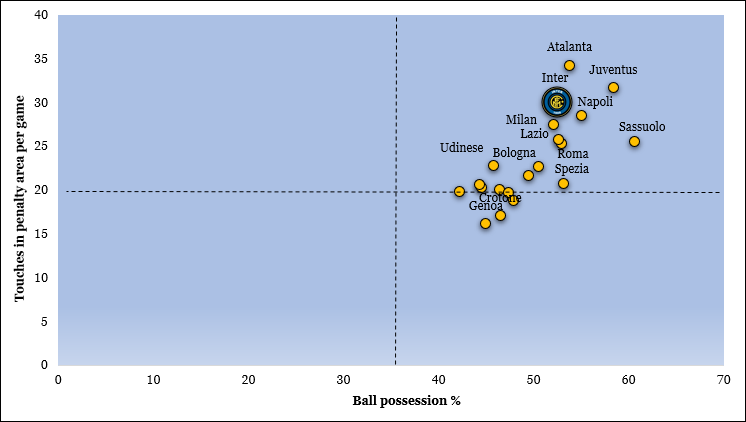
To further support the above statement, we look at the ratio between possession and touches in the attacking penalty area. In this case, Inter shine even more, recording the 3rd highest number of touches in the opposition penalty area in Serie A at 30.1. It suggests incredibly effective positional play considering the amount of possession they have per game.
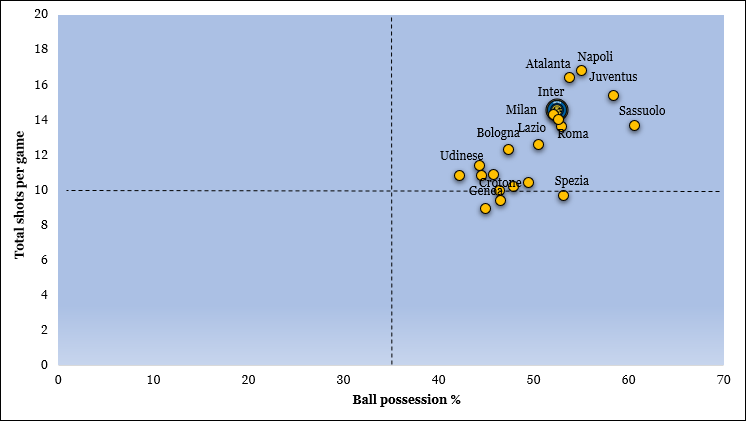
Finally, we can evaluate the effectiveness of Inter’s positional play by looking at the relationship of possession and total shots. As explained above, the Nerazzurri utilize a more progressive approach in terms of moving the ball from one third of the pitch to another, which is an effective way of creating a high number of shooting opportunities, as shown in the graph below. Inter rank 4th in the league in number of total shots, averaging 14.6 per game, with 36.0% of all attempts hitting the target.
Inter Out of Possession
Winning the league is hardly possible if a team cannot defend; therefore, in the second part of the analysis, we look at Inter’s defensive performance by examining the key defensive metrics.
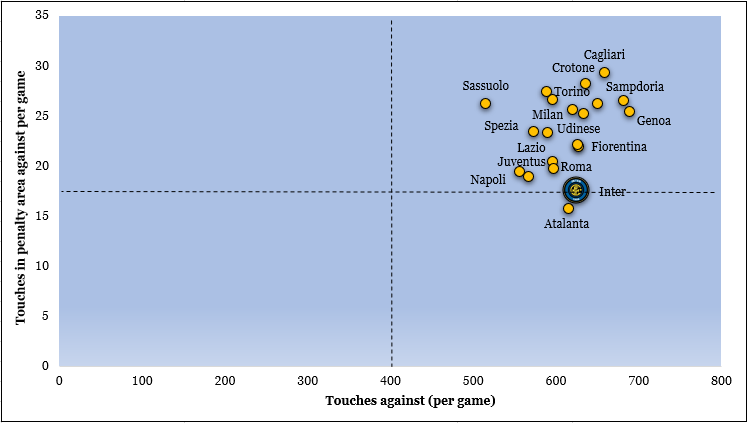
As mentioned earlier, the Nerazzurri have the best defensive record in the league, conceding just 30 goals this season. Simply put, in order to prevent the opposition from scoring, you must not allow them to enter your own penalty area and also prevent them from taking shots from distance. In the diagram below, we can see that Inter are letting their opponents to have the ball for longer than one would normally expect from a title winning team. The Nerazzurri allow an average of 623 opponent touches per game, which is the highest among the top six teams in Serie A.
Inter’s defensive prowess come to the fore, however, when we look at the number of opposition touches in their own penalty box. In this case, Conte’s side are the 2nd best team in Serie A, allowing an average of just 17.6 opponent touches in their own box per game. It suggests that Inter are incredibly good at blocking passing lanes when defending in a rigid 5-3-2 block, which subsequently makes it difficult for the opposition to enter Inter’s penalty area.
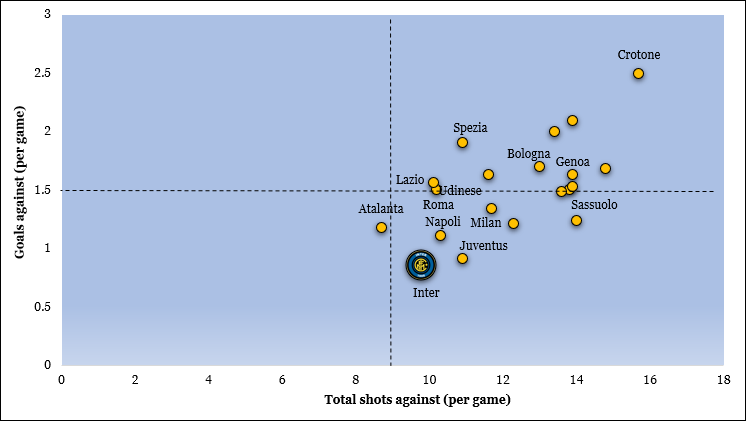
Finally, teams that prevent the opposition from entering their own penalty area do not allow them to have many shot attempts. This can be confirmed in the case of Inter, as the newly crowned Serie A champions concede an average of 9.77 shots per game, which is the 2nd best record in the league behind Atalanta (avg. 8.69). Consequently, Inter are the team that concedes the fewest goals per game with 0.86.
Conclusion
In summary, after 11 years of waiting, Inter are a deserved Scudetto winner. Their direct, counter-attacking approach proved successful despite having less possession over 90 minutes compared to the other top teams in the league. In addition, a solid 5-3-2 defensive block was an unsolvable mystery for most opposing teams, with Inter masters at preventing them from getting the ball into their penalty area, which limited shot attempts.